Symbotic's Backlog Does Not Buy the Multiple

Summary: Symbotic (NASDAQ: SYM) fell to $52.29 after fiscal Q2 results, down 7.34% in the latest market snapshot. The business is not broken: Q2 revenue was $676.5 million, cash plus restricted cash was about $2.0 billion, and management discussed contracted backlog of about $22.7 billion. The mispricing is narrower and more uncomfortable. The market is treating the earnings drop as a reset, while the converted-equity valuation still requires years of smooth warehouse deployments, clean backlog conversion, and no serious customer-concentration shock.
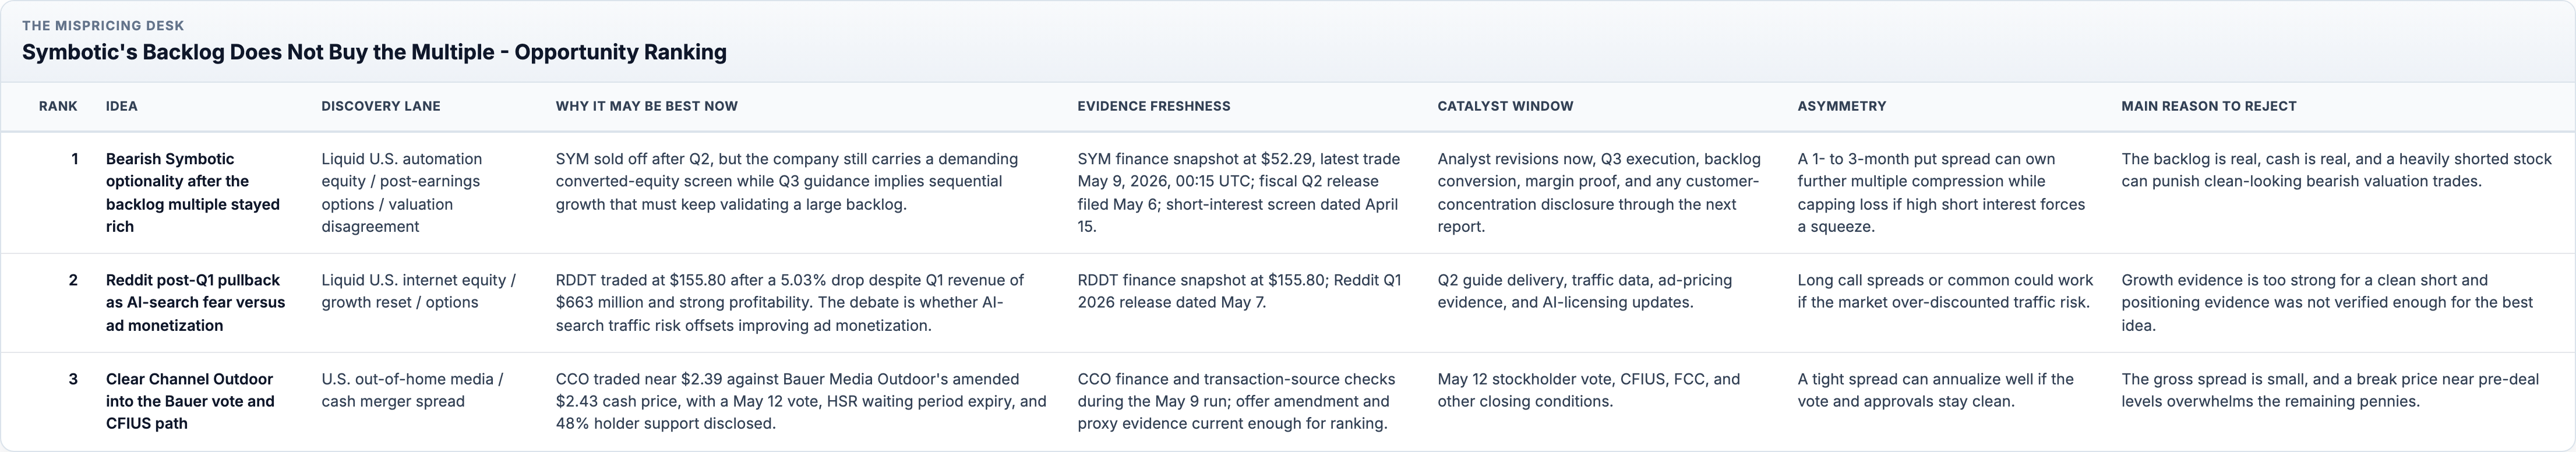
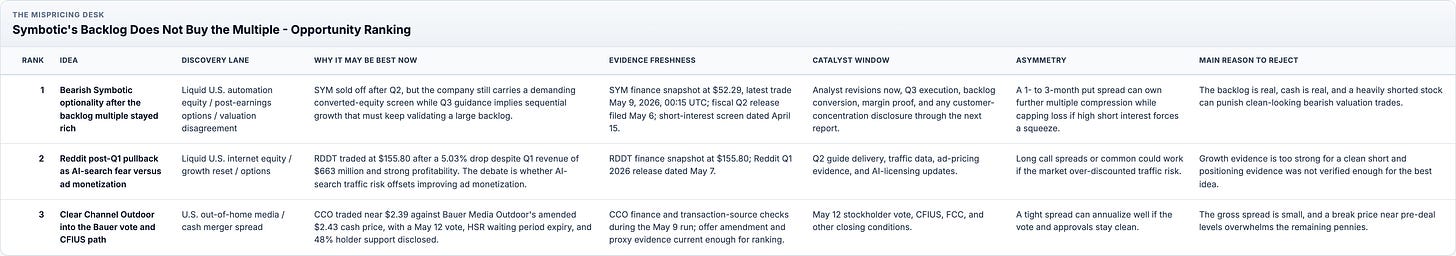
Opportunity Ranking
Selected opportunity: Defined-risk bearish Symbotic optionality.
Why this one now: The desk has published several cash-spread notes. Symbotic is a different setup: a liquid, optionable automation stock where the latest quarter gave bulls enough evidence to defend the story, but not enough to justify ignoring valuation, share-structure screens, and backlog-conversion risk.
What should surprise the reader: The surprise is not that Symbotic has a large backlog. The surprise is that the backlog can be both real and insufficient. At this valuation, a $22.7 billion contract book is not a margin of safety. It is a promise the company must keep converting without execution slippage.
The Setup
Symbotic reported fiscal Q2 2026 revenue of $676.5 million, up 23% year over year, with $77.8 million of adjusted EBITDA and $9.4 million of net income attributable to Symbotic Inc. The balance sheet had about $2.0 billion of cash, cash equivalents, and restricted cash. Management guided fiscal Q3 revenue to $700 million to $720 million and adjusted EBITDA to $80 million to $85 million. Source: Symbotic fiscal Q2 2026 8-K exhibit. Management also discussed contracted backlog of about $22.7 billion on the Q2 call. Source: Symbotic fiscal Q2 2026 earnings-call transcript.
Those numbers are good enough to keep the bull case alive. They are not good enough to make the current valuation dull.
The stock traded at $52.29 in the latest finance snapshot, down $4.14 on about 2.9 million shares. The same quote feed showed a headline market capitalization of about $7.0 billion, but that number is not a safe valuation denominator for Symbotic because of the company’s multi-class and converted-share structure. Finviz’s current screen, which attempts to account for the broader economic share base, showed roughly $31.0 billion of market capitalization and $35.3 billion of enterprise value. The important point is not which free quote screen is perfect. The important point is that the cheap-looking Class A headline can understate the economic claim investors are actually pricing.
That is the setup: a real business with real growth, real cash, and a real backlog, priced as if the next several years of deployment will remain mostly frictionless.
The Mispricing
The market appears to be pricing Symbotic as a temporary post-earnings dip in a structurally scarce automation winner. That may be correct. Warehouse automation is not a fad, labor scarcity supports the category, and a large contracted backlog is better than a loose sales pipeline.
The variant view is that the stock still embeds too much execution perfection. Revenue of $676.5 million in Q2 annualizes to about $2.7 billion. Even using management’s Q3 guide, the business is still being valued at a high multiple of near-term revenue on converted-share screens. That valuation can work only if backlog converts on schedule, gross margins hold, customer concentration does not bite, and capital intensity stays under control.
The market is not missing the backlog. It may be overpaying for the backlog before the margin, cadence, and concentration risks are fully proven.
Price
The current market level is the first anchor. SYM was $52.29 in the latest finance snapshot, after opening at $55.50, trading as low as $50.76, and closing the snapshot down 7.34%. The finance feed timestamp was May 9, 2026, 00:15 UTC, equal to May 9, 2026, 07:15 in Vietnam.
The second anchor is valuation ambiguity. A quote feed that shows only the public Class A market cap can make Symbotic look less demanding than it is. A screen that incorporates the broader economic share count shows a much larger company. This matters because a bearish thesis here is not “cash balance versus quoted market cap.” That would be sloppy. The thesis is that the converted-equity valuation still prices backlog conversion too generously after a one-day reset.
The third anchor is expectations. Q3 revenue guidance of $700 million to $720 million requires sequential progress from Q2. That is not heroic, but it leaves little room for deployment friction if investors continue underwriting the stock as a premium automation platform.
Positioning
Short interest is visible enough to shape the trade expression. StockAnalysis showed 14.17 million shares sold short, or 12.87% of float, for the latest available April 15 short-interest date. That is not a complete positioning map, and float definitions can vary in Symbotic because of the share structure. It is still enough to reject a naked short as the clean default.
The better positioning read is this: bulls have a fresh earnings defense, bears have a valuation argument, and short sellers are already present. That creates two-way violence. A weak Q3 guide or margin wobble can press the stock lower. A single strong customer or deployment headline can force shorts to cover quickly.
The trade expression should respect both facts. This is a put-spread setup, not a hero short.
Catalyst
The catalyst path has three parts.
First, the market must digest fiscal Q2 after the initial selloff. If analysts defend the backlog and keep long-term targets intact, the stock can stabilize. If they cut multiple assumptions instead of near-term numbers, the selloff can continue without another bad headline.
Second, fiscal Q3 has to validate the guide. The company guided to $700 million to $720 million of revenue and $80 million to $85 million of adjusted EBITDA. A clean Q3 print would weaken the bear case. A revenue or margin miss would make the backlog multiple harder to defend.
Third, any customer-concentration, rollout-timing, or free-cash-flow evidence matters more than another generic automation story. Symbotic’s valuation already gives credit for the category. The next evidence has to prove execution quality.
Payoff Map
One possible expression is a 1- to 3-month SYM put spread, structured after checking the live option chain. The spread should be centered around the current stock price with the lower strike near the $40 to $45 zone if premiums and bid-ask widths are acceptable.
The reason to prefer a put spread is not timidity. It is market structure. SYM has visible short interest, a real growth story, and a history of sharp moves. A naked short can be right on valuation and still lose money before Q3 if the tape squeezes. An outright put has cleaner convexity but can overpay for implied volatility after earnings. A put spread gives up crash payoff in exchange for lower premium and defined loss.
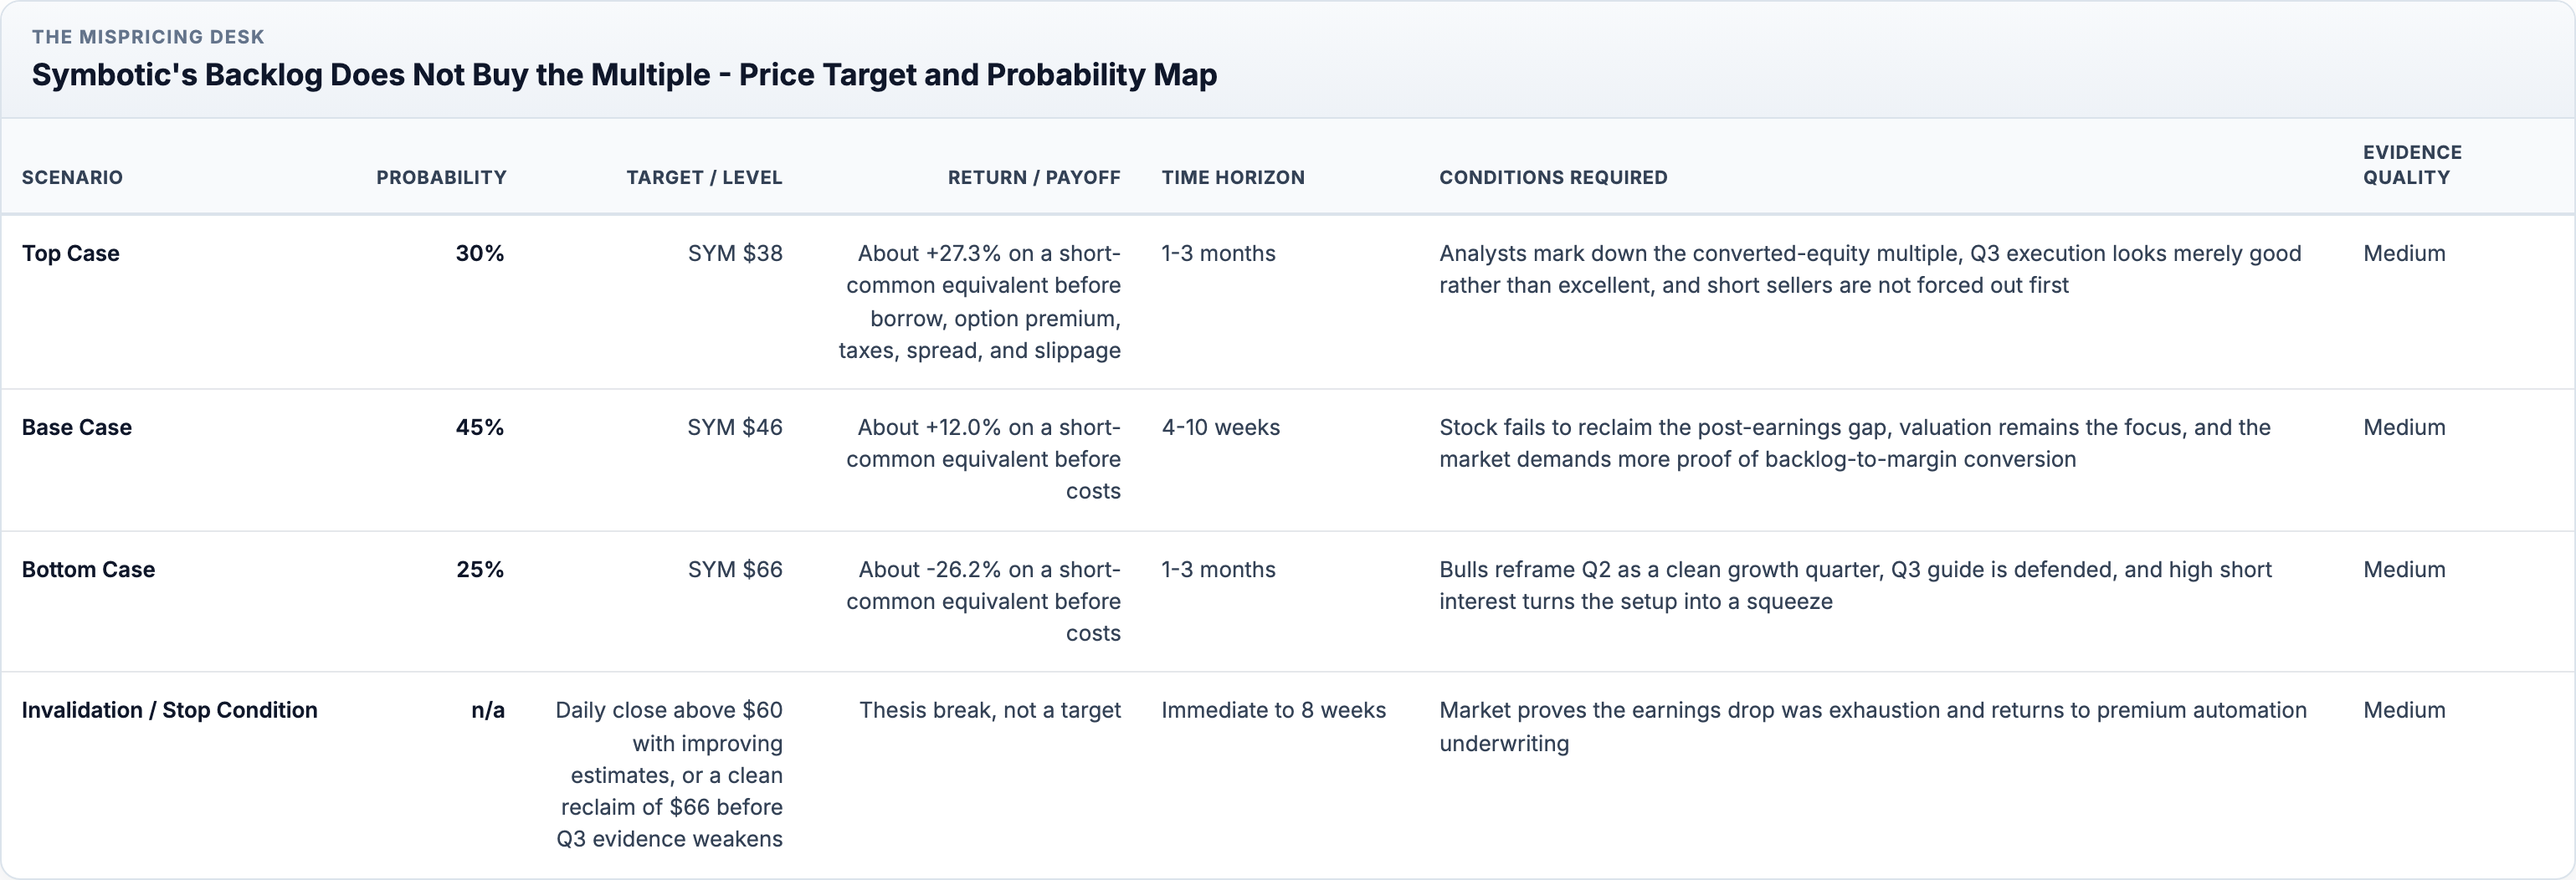
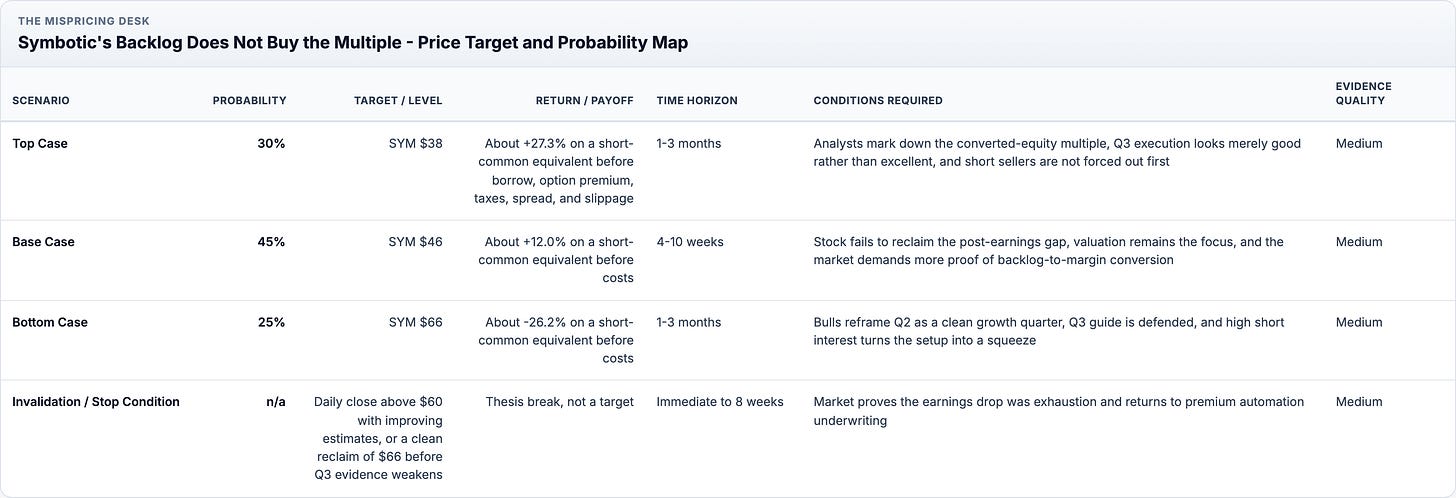
Price Target and Probability Map
Probability-weighted expected value: Expected scenario price is about $48.60, implying roughly +7.1% on a bearish short-common equivalent from $52.29 before borrow, option premium, taxes, spread, and slippage. For a put spread, true EV cannot be computed responsibly without live option premiums and executable fills.
Current market price / level: SYM $52.29, latest trade May 9, 2026, 00:15 UTC, equal to May 9, 2026, 07:15 Vietnam time. Finance snapshot checked during the May 9 Vietnam run.
Timestamp: May 9, 2026, Vietnam time.
Primary instrument: SYM listed options, preferably a defined-risk put spread.
Alternative expressions considered: Short SYM common, outright puts, put spreads, bearish call spreads, and waiting for Q3. Short common is too squeeze-sensitive. Outright puts may overpay for post-earnings volatility. Bearish call spreads introduce assignment and upside-gap discomfort. Waiting for Q3 may lose the current valuation reset. A put spread best matches the thesis if the live chain offers acceptable bid-ask width.
Confidence: Medium.
What Would Prove This Wrong
This thesis weakens if SYM closes above $60 while revenue and adjusted EBITDA estimates move higher, because that would show the market is absorbing the selloff as a buying opportunity rather than a valuation reset. It fails if the stock reclaims roughly $66 before Q3 evidence weakens, or if management produces fresh proof that backlog conversion is accelerating with margin expansion.
The thesis also fails if live options are too expensive. If the put spread requires a move below the base-case target just to break even, the trade is no longer priced well, even if the valuation argument is directionally right.
Risk Audit
Strongest counterargument: Symbotic has a real contracted backlog, $2.0 billion of cash-like liquidity, positive adjusted EBITDA, and a Q3 guide that implies sequential growth. A bullish investor can argue that the post-earnings drop already priced the valuation concern while leaving a scarce automation asset below its recent high.
Most fragile assumption: The thesis assumes the market will care about converted-equity valuation before Q3. If investors focus on backlog scarcity and near-term revenue guide instead, the multiple can stay rich.
What the market may already know: The high multiple, share-structure complexity, and customer-concentration risk are not secret. The edge is not hidden data. It is refusing to treat backlog as a sufficient valuation floor.
What could make the trade lose money even if the thesis is directionally right: A short-dated put spread can decay during a sideways tape. Implied volatility can fall after earnings. A short squeeze can push the stock above the invalidation band before the next operating proof arrives.
Liquidity / execution risks: SYM common is tradeable, but the options chain needs strike-by-strike liquidity checks. Use limit orders. Do not assume midpoint fills.
Leverage risks: Avoid naked short leverage. A crowded short base and a real growth story can create sharp upside gaps.
Information reliability risks: Fiscal Q2 financials and guidance are primary-source. Short-interest data are from market-data screens and depend on float definitions. Converted valuation screens differ across providers because of the share structure.
Invalidation trigger: SYM daily close above $60 with positive estimate revisions, or a clean reclaim of $66 before Q3 evidence confirms any execution weakness.
Publish / revise / reject recommendation: Publish as a defined-risk options note. Do not publish as a naked short.
Bottom Line
Symbotic’s backlog is real. That is not enough. The stock still asks investors to pay for clean multi-year conversion after a quarter that was good, not decisive. The clean expression is a defined-risk SYM put spread, priced from the live chain, aimed at further multiple compression into Q3. The trade is short the remaining backlog multiple, not short warehouse automation as a category.
Sources
Symbotic fiscal Q2 2026 8-K exhibit, filed May 6, 2026.
Symbotic fiscal Q2 2026 earnings-call transcript, checked during the May 9, 2026 Vietnam run for backlog context.
OpenAI finance snapshot for SYM, RDDT, and CCO, checked during the May 9, 2026 Vietnam run.
StockAnalysis SYM statistics, checked during the May 9, 2026 Vietnam run for short-interest context.
Finviz SYM quote screen, checked during the May 9, 2026 Vietnam run for converted valuation context.
Reddit Q1 2026 financial results, candidate screen.
Clear Channel Outdoor Bauer Media amended transaction release, candidate screen
.